Benchmarks
Comparisons against other propagation engines and internal regression benchmarks.
Comparisons with other open-source Pauli and Majorana propagation engines, and an internal pytest suite for detecting regressions.
Results
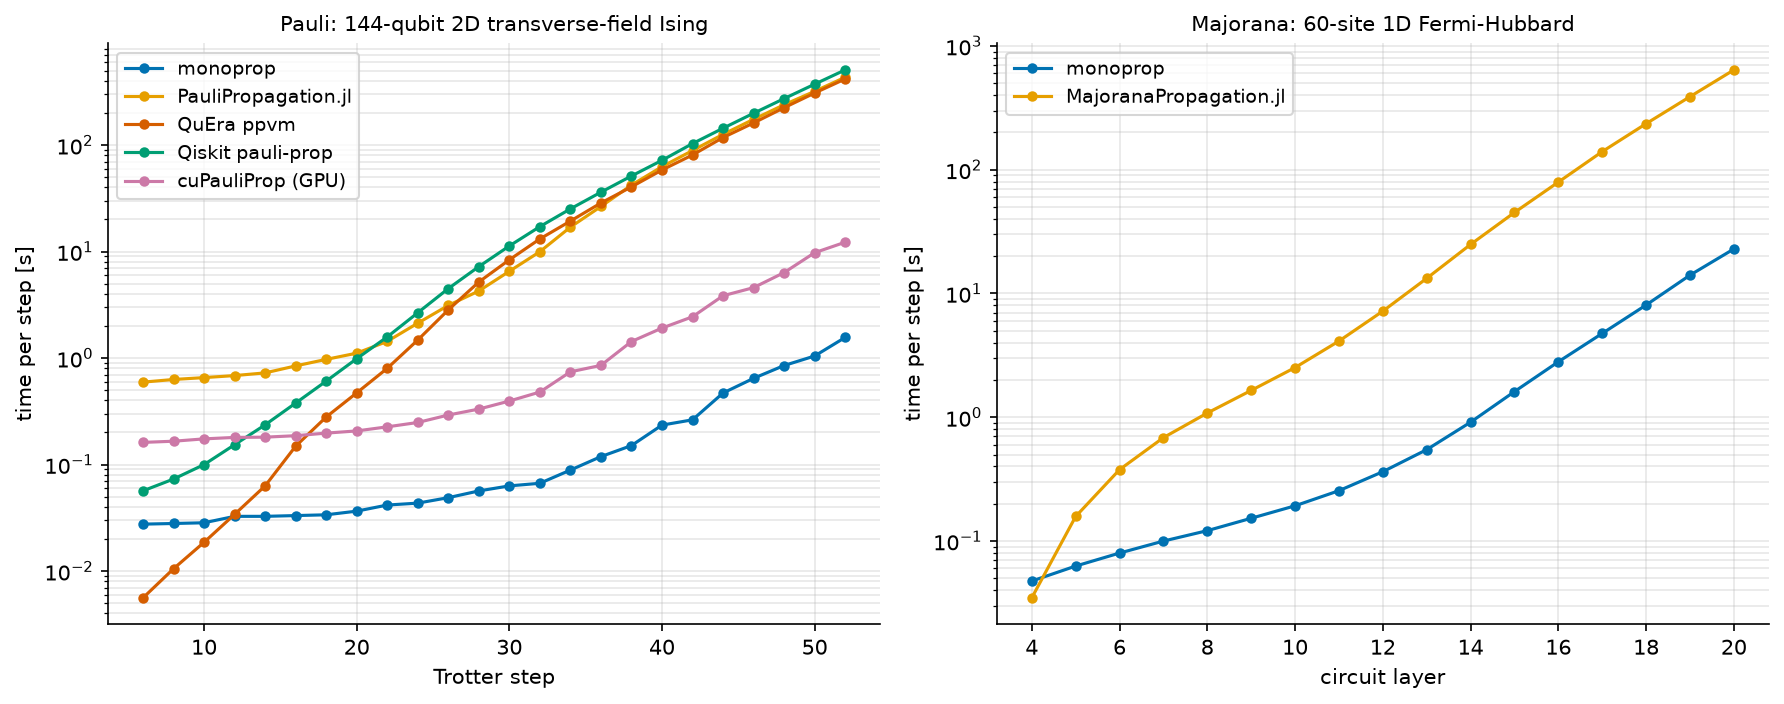
Wall-clock time per step, logarithmic. Final Pauli step, ratios to monoprop: 267-325× for the
other CPU implementations, 7.8× for the GPU one. Complete Majorana evolution: 27.7× for
MajoranaPropagation.jl 0.4.1.
All results are from exclusive nodes on Leonardo (CINECA); conditions under Methods.
Pauli propagation
Trotterized evolution of a 2D transverse-field Ising model, evaluating a ZZ correlator on a fixed
qubit pair. One experiment varies depth, the other lattice size.
Fixed lattice, increasing depth
12×12 lattice (144 qubits), 28 Trotter points, dt = 0.05, coefficient threshold 1e-6, no weight
cutoff; ~33 million terms at the end.
| Engine | Final step | VS monoprop | Peak RSS | VS monoprop |
|---|---|---|---|---|
monoprop | 1.56 s | — | 4275 MB | — |
cuPauliProp (GPU) | 12.23 s | 7.8× | 11652 MB (device) | 2.7× |
QuEra ppvm | 417.29 s | 267× | 6956 MB | 1.6× |
PauliPropagation.jl | 433.16 s | 277× | 11102 MB | 2.6× |
Qiskit pauli-prop | 507.74 s | 325× | 34270 MB | 8.0× |
Observables differ by at most 3.8e-4 among the coefficient-threshold implementations; 2.8e-3 for
Qiskit pauli-prop, which truncates by term count instead. cuPauliProp's column is peak device
allocation, its operator being on the GPU; its host RSS was 552 MB.
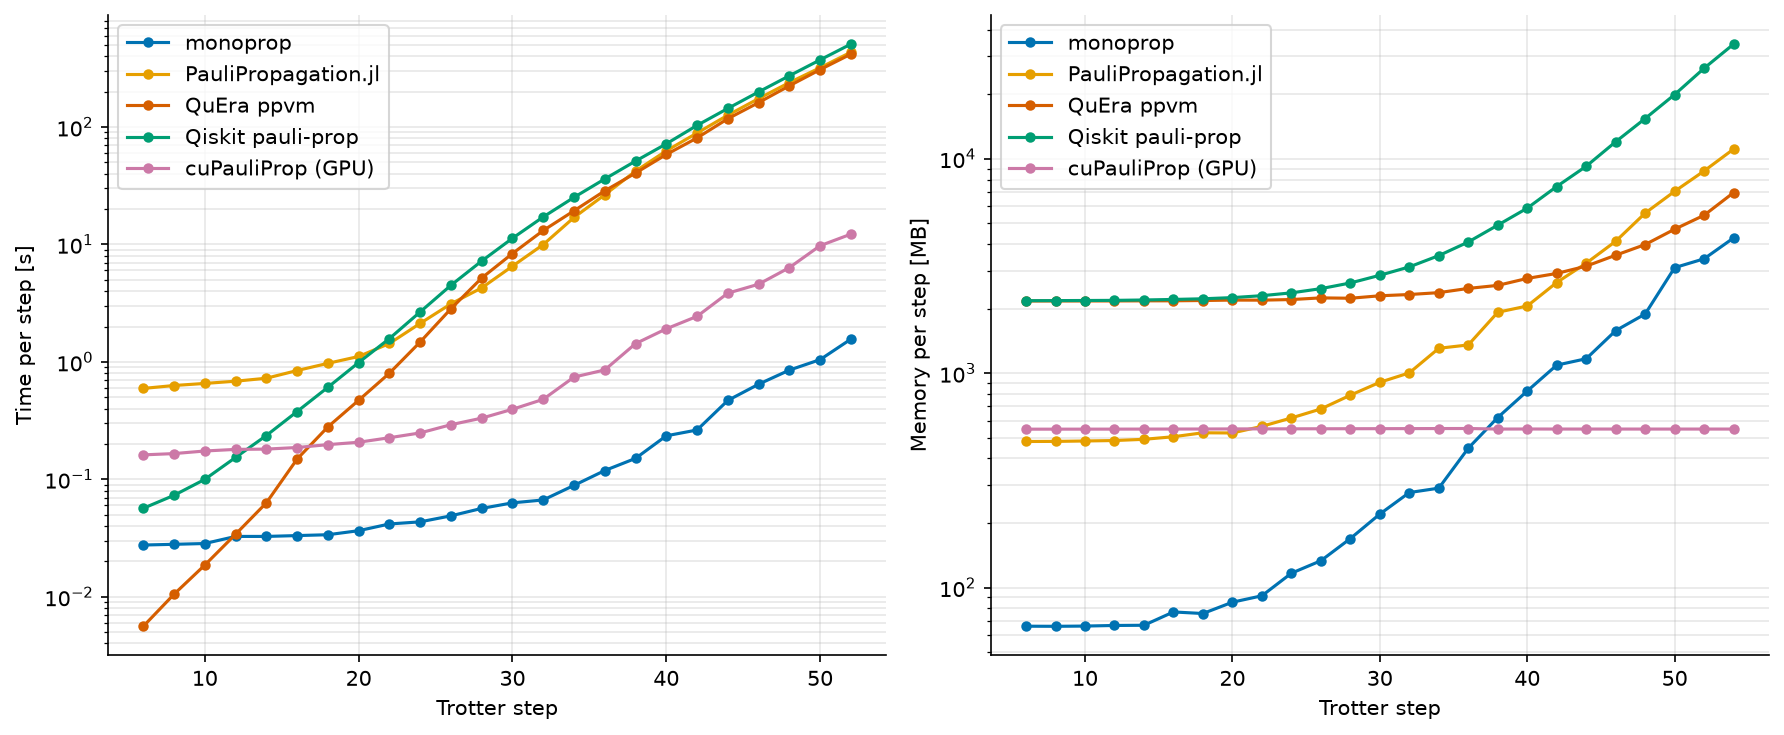
Per Trotter step; cuPauliProp reports peak GPU allocation.
Increasing lattice size
Depth and threshold fixed, lattice 6×6 (36 qubits) to 18×18 (324 qubits), one subprocess per (size,
implementation) under a 300 s limit. That limit — not the implementations — excludes QuEra ppvm and
Qiskit pauli-prop everywhere, PauliPropagation.jl above 10×10.
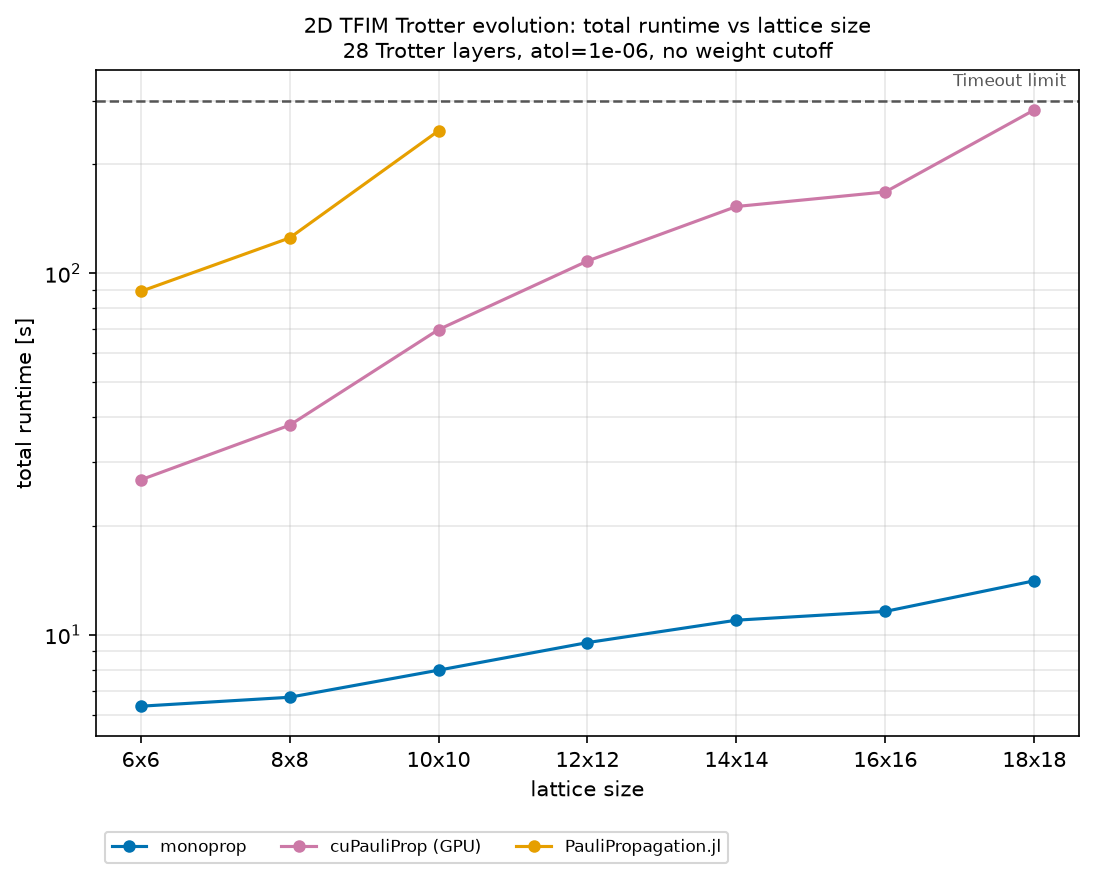
The operator saturates at ~55.0 million terms above 100 qubits, so beyond that this measures cost
per retained term. monoprop: 6.35 s to 14.1 s (2.2×) over a 9× rise in qubits.
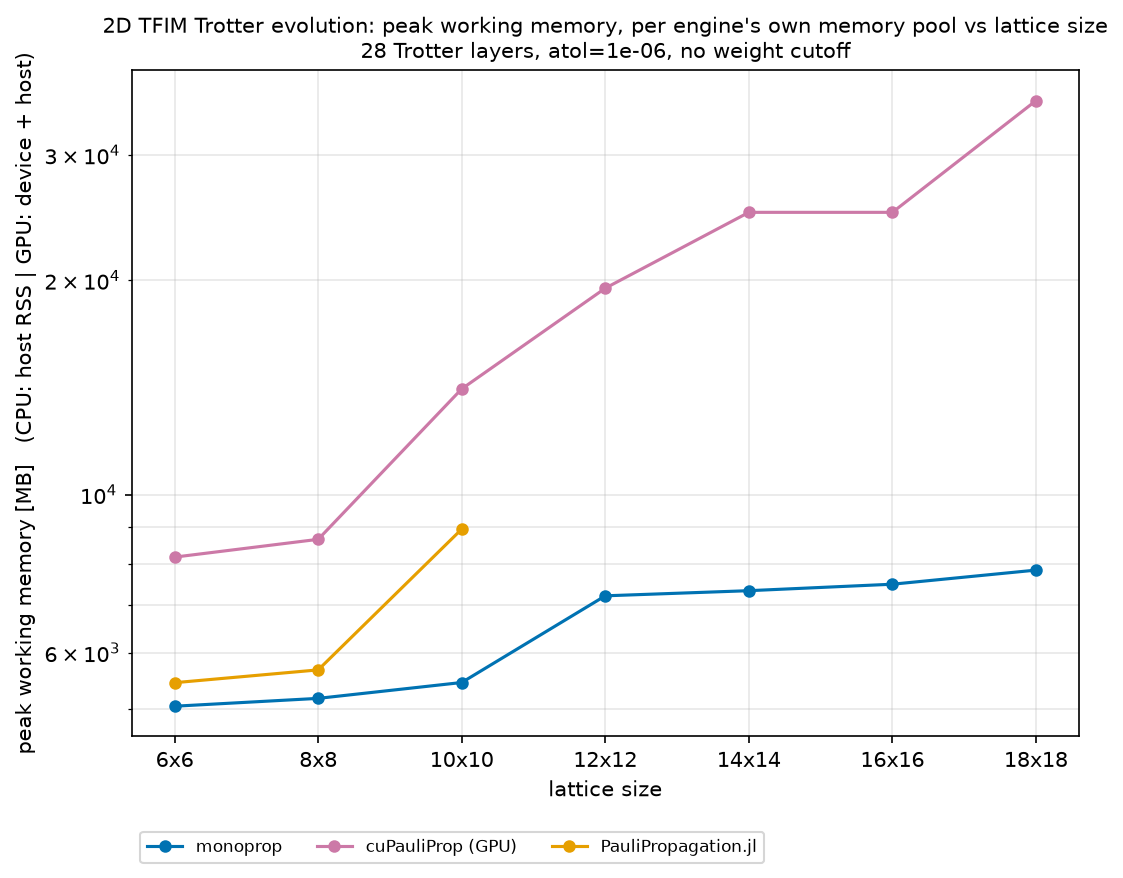
Working memory: peak host RSS for CPU, peak device allocation for cuPauliProp. monoprop 5045
MB to 7835 MB (1.55×), cuPauliProp 7.6 GB to 34.4 GB. At 324 qubits the latter is 4.5× the
monoprop host footprint, over half of the A100's 64 GB.
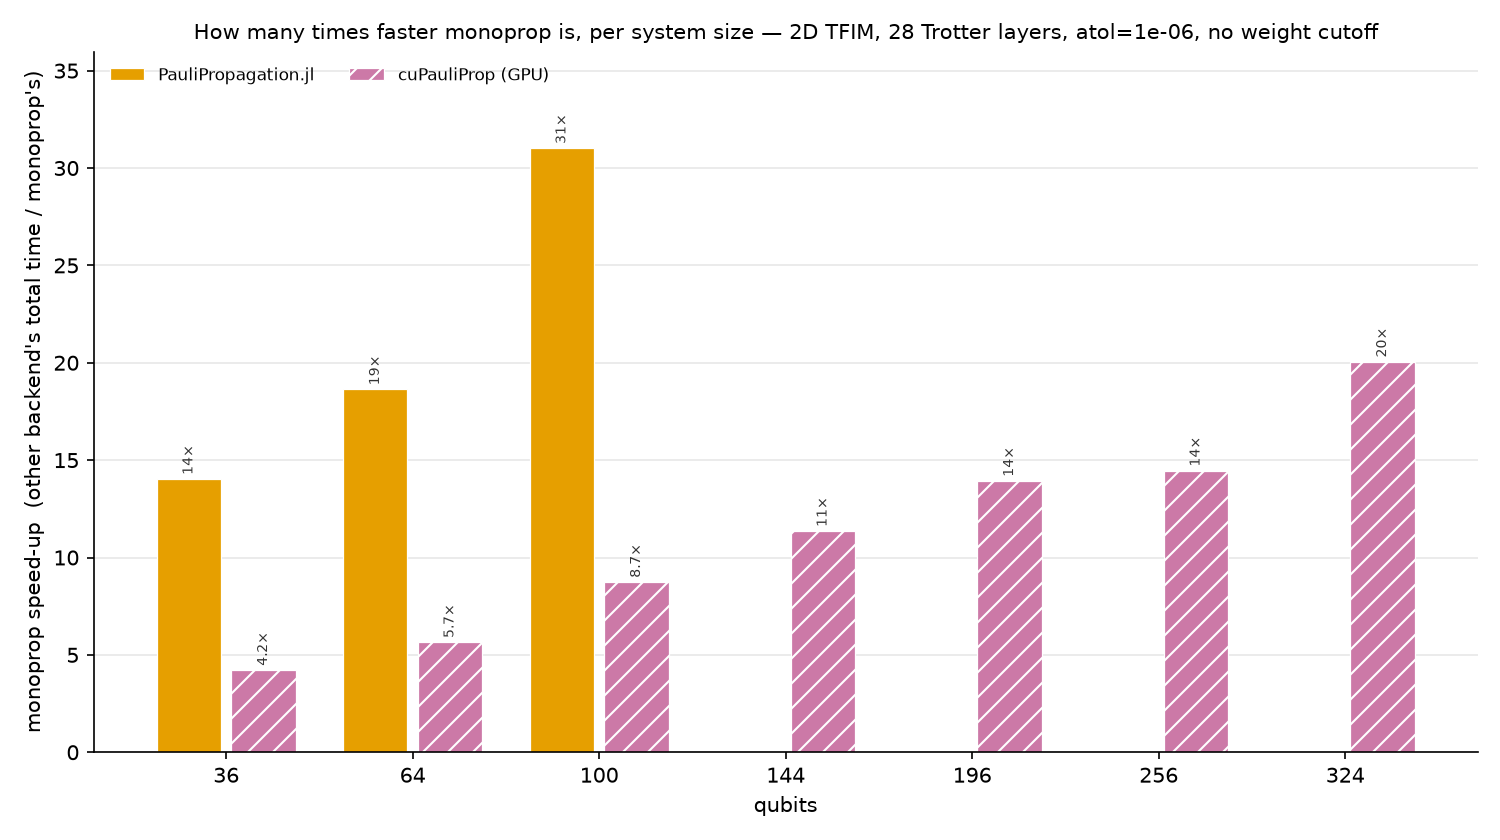
Ratios to monoprop: 14× to 31× for PauliPropagation.jl over its completed points, 4.2× to 20×
for cuPauliProp over the full range. A missing bar is a run past the 300 s limit.
Majorana propagation
20 Trotter layers of a 1D Fermi-Hubbard model, 60 spinful sites, 24 threads both sides; runtime, expectation value, term count and memory recorded per layer.
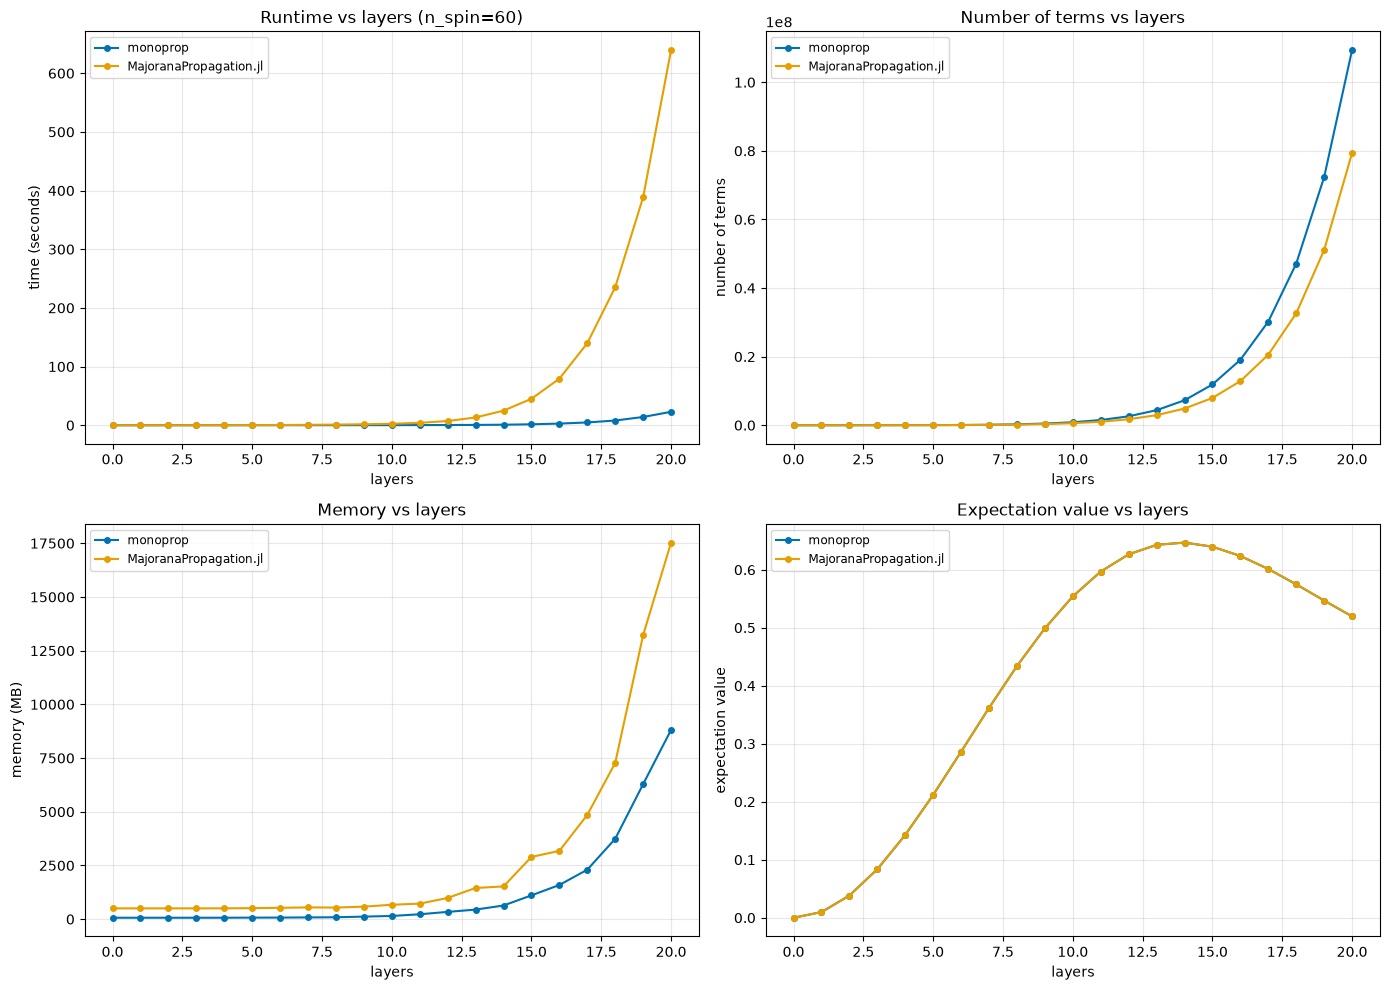
Expectation values differ by at most 2.0e-6 at every layer. At equal truncation monoprop retains
109.4 million terms against 79.4 million. Complete evolution 57.1 s against 1583.7 s (27.7×);
final layer 22.9 s against 639.4 s (27.9×). Peak RSS 8.8 GB and 17.5 GB.
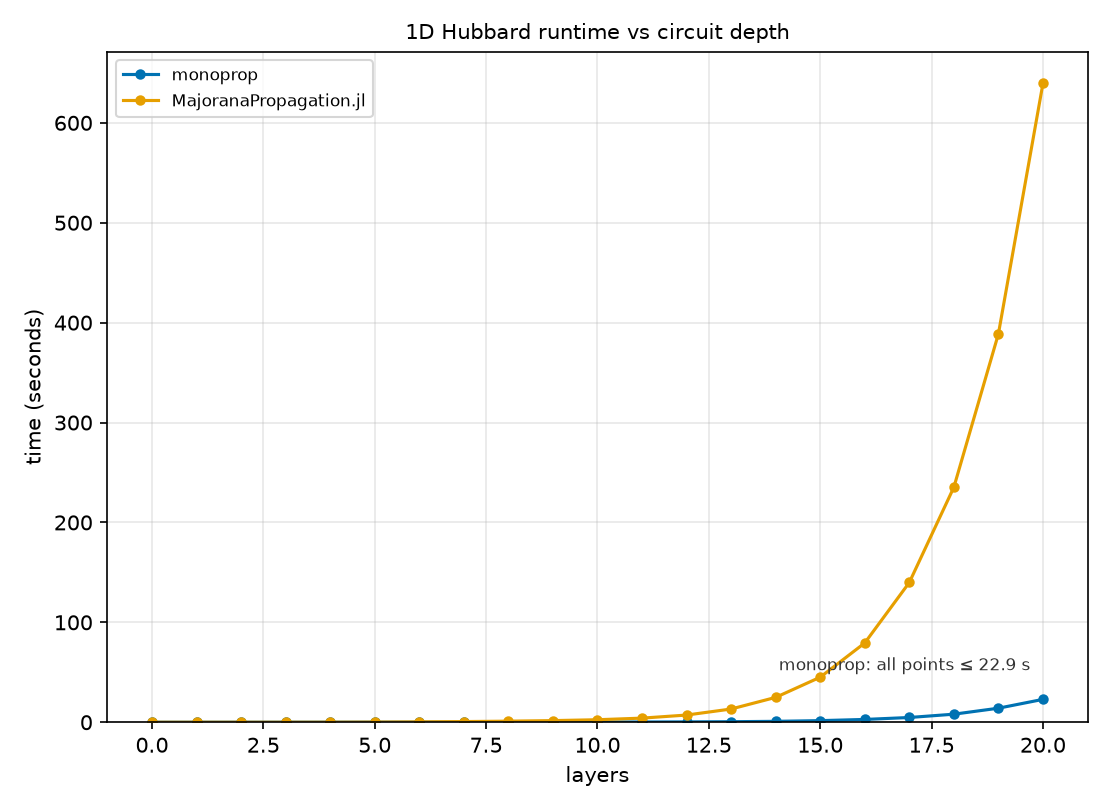
Linear scale. The annotation bounds the monoprop curve, which otherwise lies near the axis.
Caveats
- CPU parallelism differs, so these are wall-clock ratios, not per-core ones.
QuEra ppvmandQiskit pauli-proppropagate on one core (0.99 measured active cores); theppvmbindings expose the serialindexmapvariant rather than the Rayon-parallelconfig::dashmap, and Qiskit's_acceleratehas no parallel propagation path. - The Julia benchmarks use the fastest documented containers:
VectorPauliSumwithPerformance.propagate!(development branch 0.8.0 or later) andVectorMajoranaSumwith AcceleratedKernels; the dictionary-backed alternatives are serial. The vector Pauli path does not merge duplicate strings, so its term count is a storage count. - CPU and GPU use different node types, so the
cuPauliPropcomparison includes hardware as well as implementation effects.
Methods
Drivers:
packages/bench-third-party,
a standalone uv project, outside the workspace because it needs CUDA-specific wheels and a
narrower Python range.
Hardware
Different partitions for CPU and GPU, because Leonardo's DCGP nodes have no GPUs.
| Partition | Hardware | Engines |
|---|---|---|
| DCGP (CPU) | 2× Intel Xeon Platinum 8480+, 112 cores, ~480 GB RAM | monoprop 0.8.1.dev61+gcb9a033aa (56 threads), PauliPropagation.jl 0.8.2 on Julia 1.12.6 (28 threads), QuEra ppvm 0.1.0, Qiskit pauli-prop 0.2.0 |
| Booster (GPU) | NVIDIA A100-SXM-64GB, 8 host cores | cuPauliProp via cuquantum-python-cu12 26.6.0 |
Best known configuration each: monoprop on all 56 cores of one socket, PauliPropagation.jl on 28
threads, more reducing its throughput. Every record carries host, threads, library_version.
How memory is measured
Peak resident set size, from the kernel's VmHWM, with shared pages counted in full; peak
device allocation for cuPauliProp instead. Exact, and identical for every CPU implementation over
the timed region, reset per step behind gc.collect() + malloc_trim (GC.gc() for Julia).
native_memory additionally records each implementation's own estimate, comparable only within one
implementation.
Reproducing
cd packages/bench-third-party
uv sync    # monoprop (editable), qiskit, ppvm, pauli-prop, cuquantum-python-cu12

# Julia only for the Julia comparisons
curl -fsSL https://install.julialang.org | sh          # juliaup + latest stable Julia
julia -e 'using Pkg; Pkg.add(["JSON", "ProgressMeter"])'# Pauli, fixed lattice; edit settings.json to change the model
cd pauli_prop
uv run python run_model.py # CPU engines -> results.json
julia run_model.jl # optional; merges PauliPropagation.jl in
uv run python run_model.py --backends cupauliprop -o results_gpu.json # on a GPU node
uv run python plot_results.py
# Pauli, lattice sweep; 300 s limit per (size, engine)
uv run python run_scaling.py --output scaling_cpu.jsonl --timeout 300 \
--backends monoprop juliapp ppvm qiskit --threads monoprop=56 juliapp=28
uv run python run_scaling.py --output scaling_gpu.jsonl --timeout 300 \
--backends cupauliprop # on a GPU node
# The first input takes precedence when a backend occurs in both files
uv run python plot_scaling.py scaling_cpu.jsonl scaling_gpu.jsonl
uv run python plot_scaling.py scaling_cpu.jsonl scaling_gpu.jsonl \
--memory-key working_set_MB
uv run python plot_speedup.py scaling_cpu.jsonl scaling_gpu.jsonl
# Majorana
cd ../majorana_prop
monoprop_NUM_THREADS=24 JULIA_NUM_THREADS=24 bash run_benchmarks.sh
# Two-panel headline figure from both committed result sets
cd .. && uv run python plot_headline.pyModel parameters:
settings.json.
Output schemas and per-implementation limitations:
packages/bench-third-party/README.md.
Internal benchmarks
A pytest suite measuring runtime and peak RSS of core operations, separate from the functional tests
and run with just bench.
Running
Each run takes a label, naming its column in results/REPORT.md, so configurations sit side by
side. Extra arguments go to pytest.
uv sync --group bench                          # once

just bench serial                              # serial run, column "serial"
just bench-smoke                               # quick sanity check (tiny sizes)
just bench serial --num-modes 64 --bench-rounds 10

monoprop_NUM_THREADS=10 OMP_NUM_THREADS=10 OMP_DYNAMIC=FALSE just bench serial-t10 --runtime-shape=openmp  # T=10 shards

uv run --group bench monoprop-bench-report benches/results  # rebuild report, no re-run
Both groups measure the same four operations — build_graph, propagate, energy, gradient:
bench_random.py: a random problem, both pictures.--gen-length(4),--obs-terms(10000),--num-generators(100),--num-modes(128),--cutoff(6),--seed(0),--bench-rounds(1); defaults in parentheses.bench_models.py: two fixed models markedslow, Heisenberg only — a 120-qubit Fermi-Hubbard 29-step Trotter run ([hubbard]) and a 127-qubit kicked-Ising run over 20 layers ([pauli]). Override any config field with--<model>-<field>, e.g.--pauli-num-layers 30;just bench --helplists them.
One group per process at scale: build_graph/propagate and energy/gradient each hold their own
operator, so all four together hold two per rank. Timings go to results/time-<label>.json, the rest
to <label>.json.
MPI
Barriers delimit each timed operation, so runtime is the makespan across ranks. Memory is the sum of per-rank peak RSS: an upper bound, shared pages counted once per rank and rank-local peaks summed even when they never coexisted.
Declare a multi-rank run's shape with --runtime-shape=openmp (below); the declared shape is recorded in meta.
Without a declaration the suite keeps the removed partition runtime's guard and asks for monoprop_PARTITIONS
above one rank, which the library itself ignores. The guard stays because this suite is a frozen measurement
overlay that also serves the preserved partition baseline.
mpi4py is imported only when the imported extension reports monoprop.has_mpi: importing
mpi4py.MPI initializes MPI, which an MPI-off run must never do, even with mpi4py installed. An
MPI-off build runs one process, launched directly.
Two options declare what a run measures and fail before anything is measured when the process
contradicts them. meta records the declaration, has_mpi and the extension's SHA-256:
--runtime-shape=openmp(every current build) requiresmonoprop_PARTITIONSunset, and a positivemonoprop_NUM_THREADS, or with it unset a single positiveOMP_NUM_THREADS.--runtime-shape=partitionsserves only a binary of the removed partition runtime (the preserved baseline) and requiresmonoprop_PARTITIONSandmonoprop_NUM_THREADS, equal and positive. MPI-off builds must run one rank.--build-mode=mpior--build-mode=mpi-offmust match the imported extension'shas_mpi.
The openmp shape's requirement that monoprop_PARTITIONS be unset is measurement hygiene in the preflight:
the library ignores the variable.
just bench-build-mpi                           # build once (MPI on)
monoprop_NUM_THREADS=2 OMP_NUM_THREADS=2 OMP_DYNAMIC=FALSE just bench-mpi r5t2 5 --map-by slot:PE=2 --bind-to core
Memory exactness
Each memory window records whether its kernel reset worked on every rank, independently:
opmemexact for the operation window (opmempeak, opmembase, opmemdelta) and memhwmexact for
the outer window (memhwm, memhwm_max). One never certifies the other.
In REPORT.md, a cell from a false window reads non-exact (the peak fell back to the RSS at
exit, a lower bound). A cell with no flag, as in artifacts from before the flags existed, reads
exactness unknown. monoprop-bench-bmf publishes peak-memory only when memhwmexact is true
and operation-memory only when opmemexact is true, and warns on stderr otherwise. Latency and
terms are unaffected.
An exact window is not byte-exact on a many-core host. The kernel keeps VmHWM from per-CPU RSS
counters that it reads approximately. When threads on many CPUs fault in memory, the recorded peak
can fall short of a transient that really was resident, by tens of MiB. On a 96-core EC2 host the
shortfall ranged from 2 to 51 MiB, independent of the transient's size. A single thread loses
under 1 MiB, and VmRSS itself stays exact. Size memory comparisons so that peaks are well above
this bound.
Parity evidence for the rank-local OpenMP refactor
tools/benchmark-rank-local-openmp.py wraps the pytest suite above to collect the evidence the
rank-local OpenMP plan (docs/superpowers/plans/2026-09-18-rank-local-openmp.md) requires. It adds no benchmarks of its own, apart from the paring-construction measurement below.
The launcher, CPU binding and environment stay external. The driver checks them against a
campaign inventory and an external placement file, and refuses to run when they disagree.
It has three modes, each run in a fresh process:
observemeasures one campaign cell and writesDIR/ARM/CELL/SAMPLE/timed.json. A historical node runs in-process through pytest, and its raw artifacts are kept underSAMPLE/timed/. Add--whole-processfor a separate, untimed run that writesconstruction.json. That window opens before any input is built and closes after the operation's outputs, graph and callable are all still alive.validaterebuilds the cell's workload in an untimed process. It records the energy, the full gradient where the operation has one, and, for unpared operations, per-rank term files. Each term file is sorted, gzip-compressed JSON Lines (.jsonl.gz, level 1, with a reproducible header),{"key": [...], "real": x, "imag": y}, exported withevolved_operator(parameters, 0.0), so coefficients are rounded to1e-12. Pared operations record scalars only. Forpropagatewithout coefficient truncation, validation also checks the result against a graph replay of the same inputs.compare --campaign FILE --manifest FILE --output FILEjoins baseline and candidate artifacts against the inventory. It exits0when every cell passes,1for an unmet gate or incomplete coverage, and2for malformed or incompatible evidence.
compare applies exactly five gates per cell, each a median ratio that must be at most 1.00:
- runtime;
- operation peak, summed over ranks and per-rank maximum;
- whole-construction peak, summed over ranks and per-rank maximum.
Both exactness flags must be true. Outer-window peaks are reported as labelled diagnostics and never
gate. compare wants five paired observations per arm and cell, or ten after the prescribed
repetition, and says when a first failure needs five more.
It rejects evidence that cannot be joined:
- run IDs or measurement files reused anywhere;
- mismatched identities or build modes;
- placement files that do not certify the full team;
- artifacts from another campaign, such as calibration runs;
- an arm whose binary was built with the wrong runtime.
Each arm is bound to the runtime its extension was compiled with, read from the measured file
itself. A build sets _core.__runtime_identity__ and embeds the same NUL-terminated literal: every
current build monoprop-runtime=sharded-openmp; builds from before the partition runtime was removed
monoprop-runtime=sharded-openmp-prototype (the development selector) or
monoprop-runtime=legacy-partitions. The preflight matches each literal with its terminator, so the
final marker is never mistaken for a prefix of the prototype's, and a binary carrying two markers, or
an attribute its bytes do not carry, is refused. observe and validate require the attribute to agree
with the bytes of the file whose SHA-256 they record, and record both. Only a sharded build (final or
prototype) can serve --runtime-shape openmp (the candidate arm); a legacy build, including the
preserved partition baseline, which predates the markers, serves only partitions. compare refuses
candidate evidence without a marker-backed sharded identity for its own binary, and baseline evidence
that records a sharded one. The baseline's frozen records carry no identity field and remain
consumable; archived candidate records carry the prototype attribute, so evidence of the final binary
is told apart from them by its attribute and binary hash, never by an arm label. This is read-only
provenance, not a runtime switch: relabelling --arm, --runtime-shape or the environment cannot
change which runtime a binary contains. The benchmark suite's --runtime-shape preflight applies
the same check.
Numerically, it merges each arm's rank files into a global map and requires equal key sets, with
coefficients agreeing under abs(a-b) <= 1e-9 + 1e-7*max(|a|,|b|). The Heisenberg identity term,
replicated on every rank, is checked for agreement and counted once.
driver::pare_functional_construct[heisenberg|schrodinger] is the one measurement the driver owns.
It times only expectation_value_and_gradient_functional(1e-10) on a graph built beforehand, and
keeps the returned callable alive until both memory windows close. validate then evaluates that
callable at the recorded parameters.
# Baseline (the preserved partition baseline's own environment), MPI-off full machine: direct launch, no mpiexec.
monoprop_PARTITIONS=96 monoprop_NUM_THREADS=96 OMP_NUM_THREADS=96 taskset -c 0-95 \
  .venv/bin/python tools/benchmark-rank-local-openmp.py observe --arm baseline \
  --runtime-shape partitions --campaign "$CAMPAIGN" --cell-id "$CELL" --sample-id s01 \
  --placement "$PLACEMENT" --output "$RESULTS"
# Repeat with --whole-process in a new process; run `validate` without --sample-id.
The candidate arm uses its own environment and the ordinary public constructors, with no partition selector
and no constructor overlay (the constructor has no partition argument, and the preflight refuses a candidate
launch that sets monoprop_PARTITIONS):
# Candidate, MPI-off full machine: an ordinary MPI-off build, exact team.
monoprop_NUM_THREADS=96 OMP_NUM_THREADS=96 OMP_DYNAMIC=FALSE taskset -c 0-95 \
  "$CANDIDATE_ENV"/bin/python tools/benchmark-rank-local-openmp.py observe --arm candidate \
  --runtime-shape openmp --campaign "$CAMPAIGN" --cell-id "$CELL" --sample-id s01 \
  --placement "$PLACEMENT" --output "$RESULTS"
tools/rank-local-openmp-workloads.json holds each profile's complete configurations and
parameter vectors. tools/rank-local-openmp-campaign.json is the owner-approved, frozen inventory of
required cells, each with its identity and digests. compare treats that file as authoritative, so
evidence cannot pass by regenerating either file.
Benchmarking ladder
benches/LADDER.md holds the development ladder: five groups of configurations, each row's flags
and selector, and the shapes to run them at. Consecutive rungs differ in exactly one thing, so a
regression at one and not the one below names its own cause.
Continuous benchmarking
bench_bare_metal.yml benchmarks every commit on main on a dedicated
RunsOn EC2 node; Bencher records the series and
reports threshold violations. The ladder itself lives in bench.yml. To reproduce a rung locally,
declare its shape and take its selector and flags from the tables below — the label is your own:
export monoprop_NUM_THREADS=1 OMP_NUM_THREADS=1 OMP_DYNAMIC=FALSE   # the shape, declared
just bench l1-hubbard --runtime-shape=openmp --bench-rounds 3 -k "test_model_propagate and hubbard"

export monoprop_NUM_THREADS=2 OMP_NUM_THREADS=2 OMP_DYNAMIC=FALSE OMP_PROC_BIND=close OMP_PLACES=cores
just bench-mpi l2b 4 --map-by slot:PE=2 --bind-to core
monoprop-bench-bmf benches/results l2b    # results as Bencher Metric Format JSON
monoprop-bench-bmf merges both artifacts: each upload accepts one adapter, and the stock
python_pytest one keeps only timings.
| Measure | Unit | Source | Threshold |
|---|---|---|---|
latency | nanoseconds | pytest-benchmark mean ± 1σ | Student's t-test, upper 0.99, ≥12 samples |
peak-memory | bytes | the process's peak RSS (VmHWM) while the row ran, summed over ranks; only when memhwmexact | +10% |
operation-memory | bytes | what the timed call added above its own floor, summed over ranks; only when opmemexact | +10% |
terms | count | terms in the evolved operator | any change |
The ~GiB columns below are peak-memory. terms is deterministic for a fixed seed and size, so
any change is an algorithmic one — the only check that a timing win is not an accuracy change.
Timing alerts do not fail the build.
The rungs
Bencher keys history on (branch, testbed, benchmark, measure), so a testbed is one machine and
one shape. It is the rung name up to the first .: <cpu>-<cores>c-<prefix>, from a slugified
brand_raw and the physical core count. On the pinned c7i.4xlarge — 16 vCPU / 8 physical
cores, 32 GiB nominal (~30 usable), no swap — three testbeds:
intel-xeon-platinum-8488c-8c-L1, -L2a and -L2b.
| rungs | testbed | R × P | launch | monoprop_NUM_THREADS | rounds |
|---|---|---|---|---|---|
L1.ops, L1.propagate | L1 | 1 × 1 | pytest benches | 1 | 3 |
L2a.ops, L2a.propagate | L2a | 1 × 8 | pytest benches | 8 | 1 |
L2b.ops, L2b.propagate | L2b | 4 × 2 | mpiexec -n 4 --map-by slot:PE=2 --bind-to core | 2 | 1 |
Every rung declares --runtime-shape=openmp with an exact team (OMP_DYNAMIC=FALSE) and binds one thread per
core through OMP_PROC_BIND=close OMP_PLACES=cores; the series recorded before the partition runtime was
removed ran P pinned partitions per rank instead, so a step at that commit is the runtime change.
- One node, one MPI-enabled build, so an edge moves the shape and nothing else.
R × P= 8 at both L2 shapes. 4 × 2 pays the per-rank cost four times on one node, so it is the memory-worst shape and the one the size ceiling is set against;P= 2 keeps more than one shard inside a rank, which 8 × 1 would not.- Rounds is 1 above L1 because
pedanticbuilds round k+1's propagator before releasing k's — a memory setting, not a statistics one.
The rows
Two processes per shape, reporting to its one testbed, so all six rows share a plot. build_graph
publishes the graph energy and gradient evaluate, so those three share an operator and the
process peak is the max over them. propagate builds its own, and a fourth row holding its own would
make that peak a sum — at L2 the random row alone is 15.02 GiB on top of L2a.ops's 18.35 GiB
against ~30 usable. The three propagate models do share a process, each releasing its operator when
its row ends.
Selectors: .ops is -k "(test_random_build_graph or test_random_energy or test_random_gradient) and heisenberg",
.propagate is -k "test_model_propagate or (test_random_propagate and heisenberg)". Both take
--num-generators=1000 --num-modes=142 --cutoff=6, plus:
--obs-terms | model cutoffs | |
|---|---|---|
| L1 | 295000 | --hubbard-cutoff=10 --hubbard-lower-atol=4.2e-05 --pauli-cutoff=12 --pauli-lower-atol=1.22e-04 |
| L2 | 2500000 | --hubbard-cutoff=10 --hubbard-lower-atol=6.2e-06 --pauli-cutoff=14 --pauli-lower-atol=2.5e-05 |
L1, at sizes one thread carries, so every L2 row has a baseline below it:
| row | process | terms | ~s | ~GiB |
|---|---|---|---|---|
random build_graph | .ops | 19,902,244 | 54 | 2.56 |
random energy | .ops | 19,902,244 | 5.0 | 2.33 |
random gradient | .ops | 19,902,244 | 13 | 2.48 |
hubbard propagate | .propagate | 9,953,109 | 33 | 0.72 |
pauli propagate | .propagate | 10,069,308 | 25 | 0.92 |
random propagate | .propagate | 19,902,244 | 56 | 2.10 |
Before L1 was split that last row read 3.91 GiB, measured while build_graph's graph was still
resident; on a floor of its own it is 2.10, so peak-memory now means at L1 what it means at L2.
L2a.ops and L2b.ops, ~25 GiB:
| row | terms | ~s 1 × 8 | ~GiB 1 × 8 | ~s 4 × 2 | ~GiB/node 4 × 2 | ~GiB worst rank |
|---|---|---|---|---|---|---|
random build_graph | 167,515,463 | 83 | 19.11 | 68 | 23.71 | 6.14 |
random energy | 167,515,463 | 13 | 17.54 | 6 | 20.36 | 5.17 |
random gradient | 167,515,463 | 39 | 18.85 | 16 | 21.68 | 5.50 |
L2a.propagate and L2b.propagate:
| row | terms | ~s 1 × 8 | ~GiB 1 × 8 | ~s 4 × 2 | ~GiB/node 4 × 2 | ~GiB worst rank |
|---|---|---|---|---|---|---|
hubbard propagate | 345,519,120 | 217 | 17.95 | 217 | 18.72 | 4.68 |
pauli propagate | 253,933,183 | 119 | 21.11 | 120 | 22.15 | 5.67 |
random propagate | 167,515,463 | 58 | 15.02 | 58 | 17.29 | 4.33 |
- Process peaks: 19.11 and 21.11 GiB at 1 × 8, in 135 s and 6:57; 23.71 and 22.15 GiB/node at 4 × 2, in 90 s and 6:59. A testbed's two processes never sum.
~GiB/nodesums the node's ranks and errs high, a page shared between ranks being charged to each: the number to provision against, the wrong one to divide.- Same flags at both L2 shapes, so their term counts must match — the geometry-independence check,
held to 0% by
terms. - The sizes are the largest measured points that fit, swept at 4 × 2. A size past that OOM-kills the
instance rather than the process, taking the artifact upload with it — hence the
catof eachbmf-<rung>.jsoninbench.yml.LADDER.md's own fixed-model rows are sized for a 128-core node, not this one, and its pared L1 row is absent because--pare-thresholdis session-wide.
Inputs
rungs is one rung per line, <name> <ranks> <threads> <rounds> | <pytest args>: threads (OpenMP threads,
and so shards, per rank) an integer or per-rank for one per physical core of the rank's share, and a .suffix
picking the process within a shape. A shape that does not fit is refused rather than oversubscribed, and every
rung reads its ranks and threads back out of its result JSON, requires monoprop_PARTITIONS unset, and logs the
thread placement. Once a
testbed has history these should stay fixed — a new shape is a new prefix, so a new testbed.
No benchmark workflow gates a pull request. It tracks main, and a threshold is a report, not a
verdict. Each rung's bmf-<rung>.json and raw result JSON upload as an artifact, so a failed upload
does not take the measurement with it.